fit_static Basic Example
Basic usage example fit_static utility.
Yon can find example file from TRXASprefitpack-example fit_static subdirectory.
Peak position shifting
Go to shift subdirectory. In shift subdirectory, you can find
example_calc_peak.txtandexample_1.txtfiles. First one is simplified version of thoretically calculated x-ray absorption spectrum peak and its intensity. Last one is the fake experimental x-ray absorption spectrum.Type
fit_static -h. Then it prints help message. You can find detailed description of arguments in the utility section of this document.Type
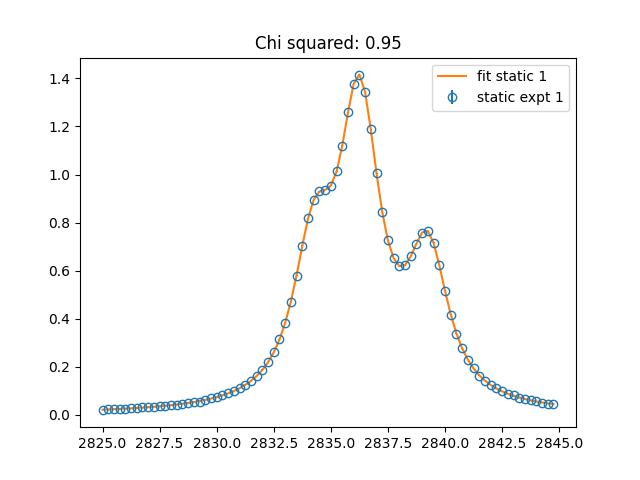
fit_staitc example 1 example_calc_peak.txt -1.25 -ls v --fwhm_G 0.5 --fwhm_L 2.0 -o exampleFirst positional argument isprefixof experimental spectrum file to fit and second positional argument is the number of scan to fit. In this example it readsexample_1.txtfile. If you setnum_scanargument to 2, it will searchexample_2.txtfile and read it if such file exists. Third positional argument is filename of theoretical line shape spectrum. In this example it readsexample_calc_peak.txtto get peak position and intensity of theoretically calculated one. Last positional argument ispeak_factor. When--scale_energyoption argument is not set, it left shift peak positions to match experimental one. In this example, it sets -1.25 as initialpeak_factor. The fist optional argument-lsor--line_shapeis line shape of spectrum. In this example it usesvvoigt profile. The second and third optional argument--fwhm_Gand--fwhm_Lare initial broadening parameter of gaussian and lorenzian part respectively. In this example, It set0.5as initial broadening parameter of gaussian part and2.0as initial broadening parameter of lorenzian part.After fitting process is finished, you can see both fitting result plot and report for fitting result in the console.
Close all fitting result plot windows, after then you can find
example_A.txt,example_base.txt,example_fit.txtandexample_fit_report.txt.
example_A.txt contains peak intensity scaling factor of each spectrum.
example_base.txt contains fitted base line feature of experimental spectrum.
example_fit.txt contains fitted thoretically calculated spectrum.
example_fit_report.txt contains fitting result report.
Peak position scaling
Go to scale subdirectory. In scale subdirectory, you can find
example_calc_peak.txtandexample_1.txtfiles. First one contains thoretically calculated IR peak information and last one is fake experimental IR spectrum.Type
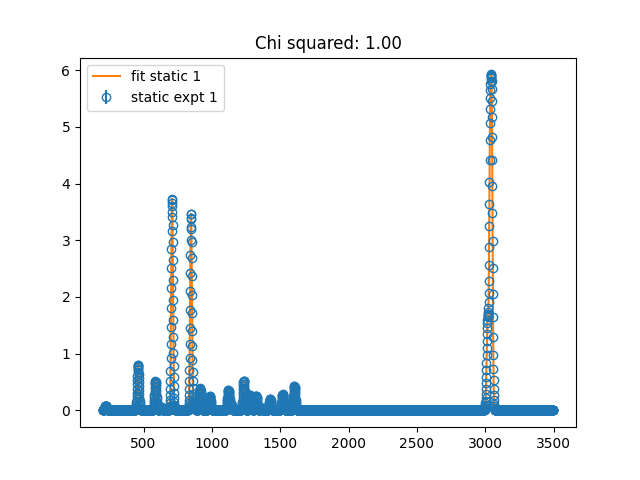
fit_staitc example 1 example_calc_peak.txt 0.95 -ls g --fwhm_G 15 --scale_energy -o example. Last positional argument is initial parameter ofpeak_factor. Since we set--scale_energy, it matchs peak position of thoretical spectrum to experimental one by uniformly scaling peak position instead of uniform shifting. In this example we useggaussian peak shape, so we need not to set--fwhm_Linitial lorenzian broadening parameter.After fitting process is finished, you can see both fitting result plot and report for fitting result in the console.
Close all fitting result plot windows, then fitting results files will be generated.